Business Intelligence with Tableau
At Relief Solutions, to carry out business intelligence and analytics, we use Tableau as a visualized platform for the intentions of helping people watch, observe, understand, and make decisions with a variety of data. Any type of graphs, plots, and charts can be made easily in it without the need for any programming.
Tableau is the rapidly growing visualization tool used for different business applications. It is high in demand software due to its easy access to use. It is widely used in BI processes. Tableau is crafted in such a way that all kinds of charts, plots, and graphs with different designs can be positioned simultaneously for visualization.
If we talk about the data type and structure and their access in tableau, it can work on any kind of data type either data is structured, unstructured datasets with the accessing of any sort of programming language as R, Python, SAS, etc. Researchers described Tableau as a “highly interactive and intuitive visual-based exploration experience for business users to easily access, prepare and analyze their data without the need for coding”
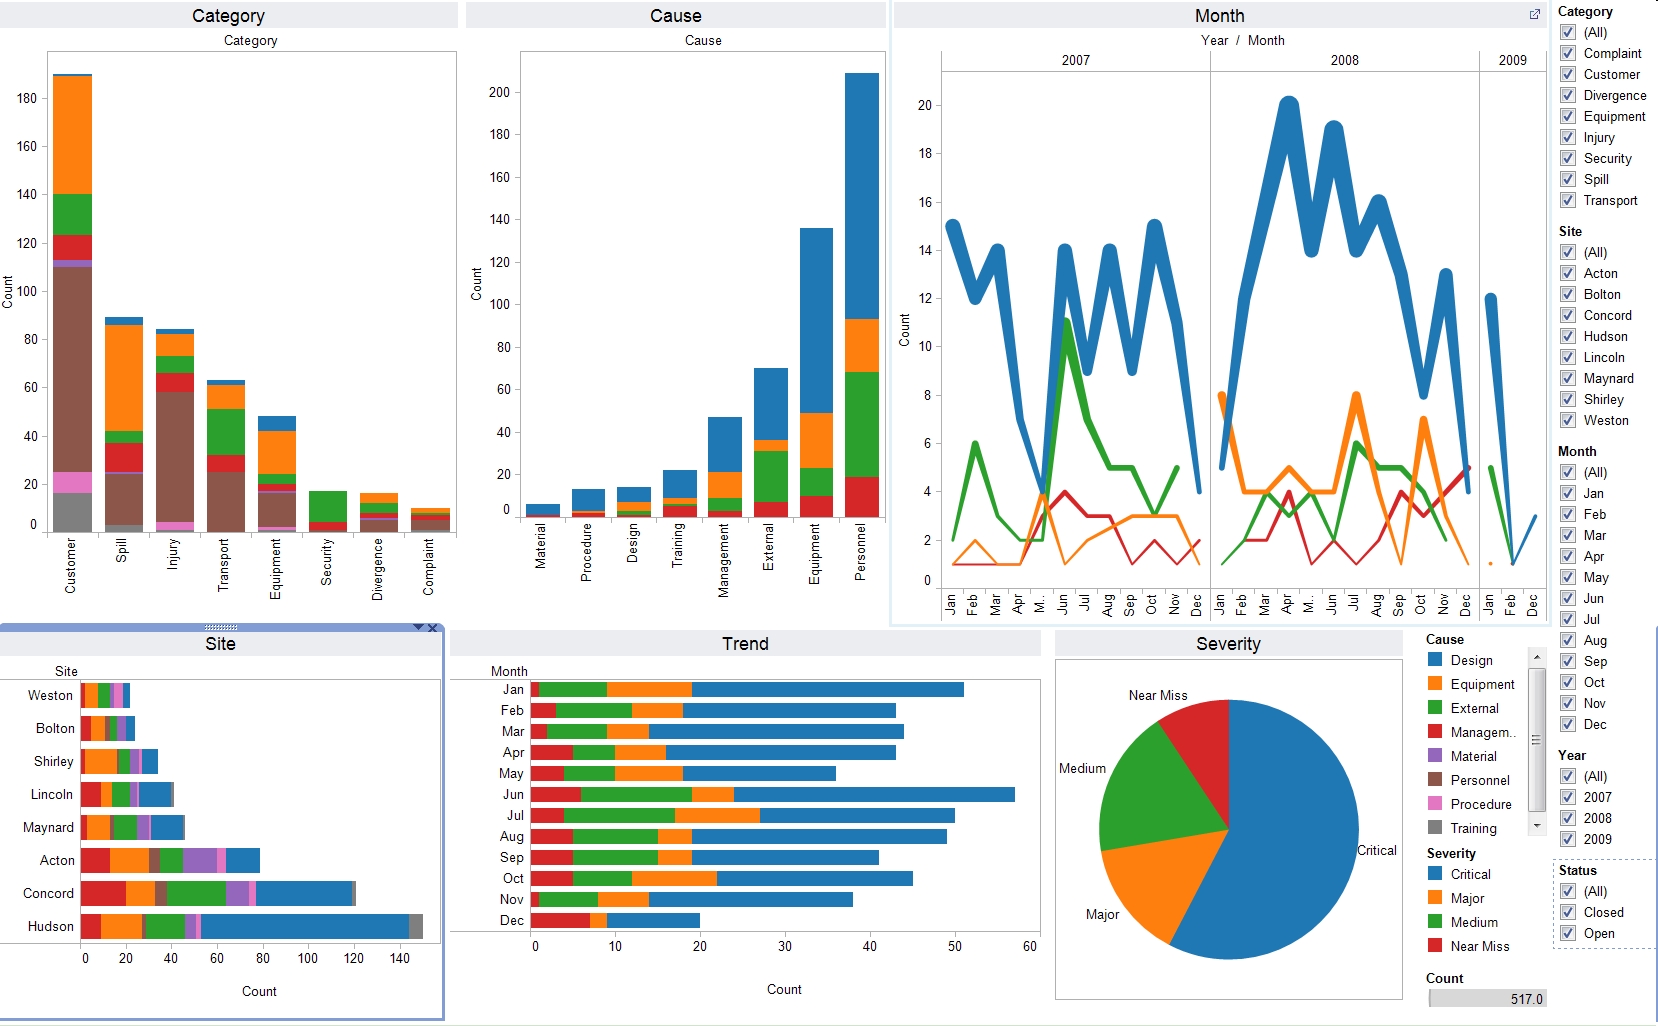
Tableau has plenty of easily accessible functions that can create highly simplified graphs or charts for any set of complex data. A business analyst can investigate any pattern, insight, flow, or trends from visually available data and hence predict or conclude for any business problem.